






Texas KeepsGrowing!

Infrastructure must keep up to maintain the miracle

Texans already see what growth means on the road.

More people. More freight. More traffic. More demand on roads and bridges built for a Texas with fewer people.

The question is whether we keep planning ahead, or wait until congestion, repairs, and construction costs become harder to manage.

Texas Infrastructure Now is working to make sure lawmakers continue planning ahead and investing in the transportation system families, workers, businesses, and communities depend on every day.

0M
New Texans since 2024
0B
Vehicle miles traveled annually
0T
Tons of freight moved annually
0%
Urban Interstates congested at peak
$0.0B
Annual Interstate benefit to Texas

Texans

already understand the pressure on roads and bridges.

A recent Texas voter survey found broad support for continued investment in transportation infrastructure. Voters may live in different regions and face different traffic problems, but the concern is consistent: Texas needs roads and bridges that keep up with growth.

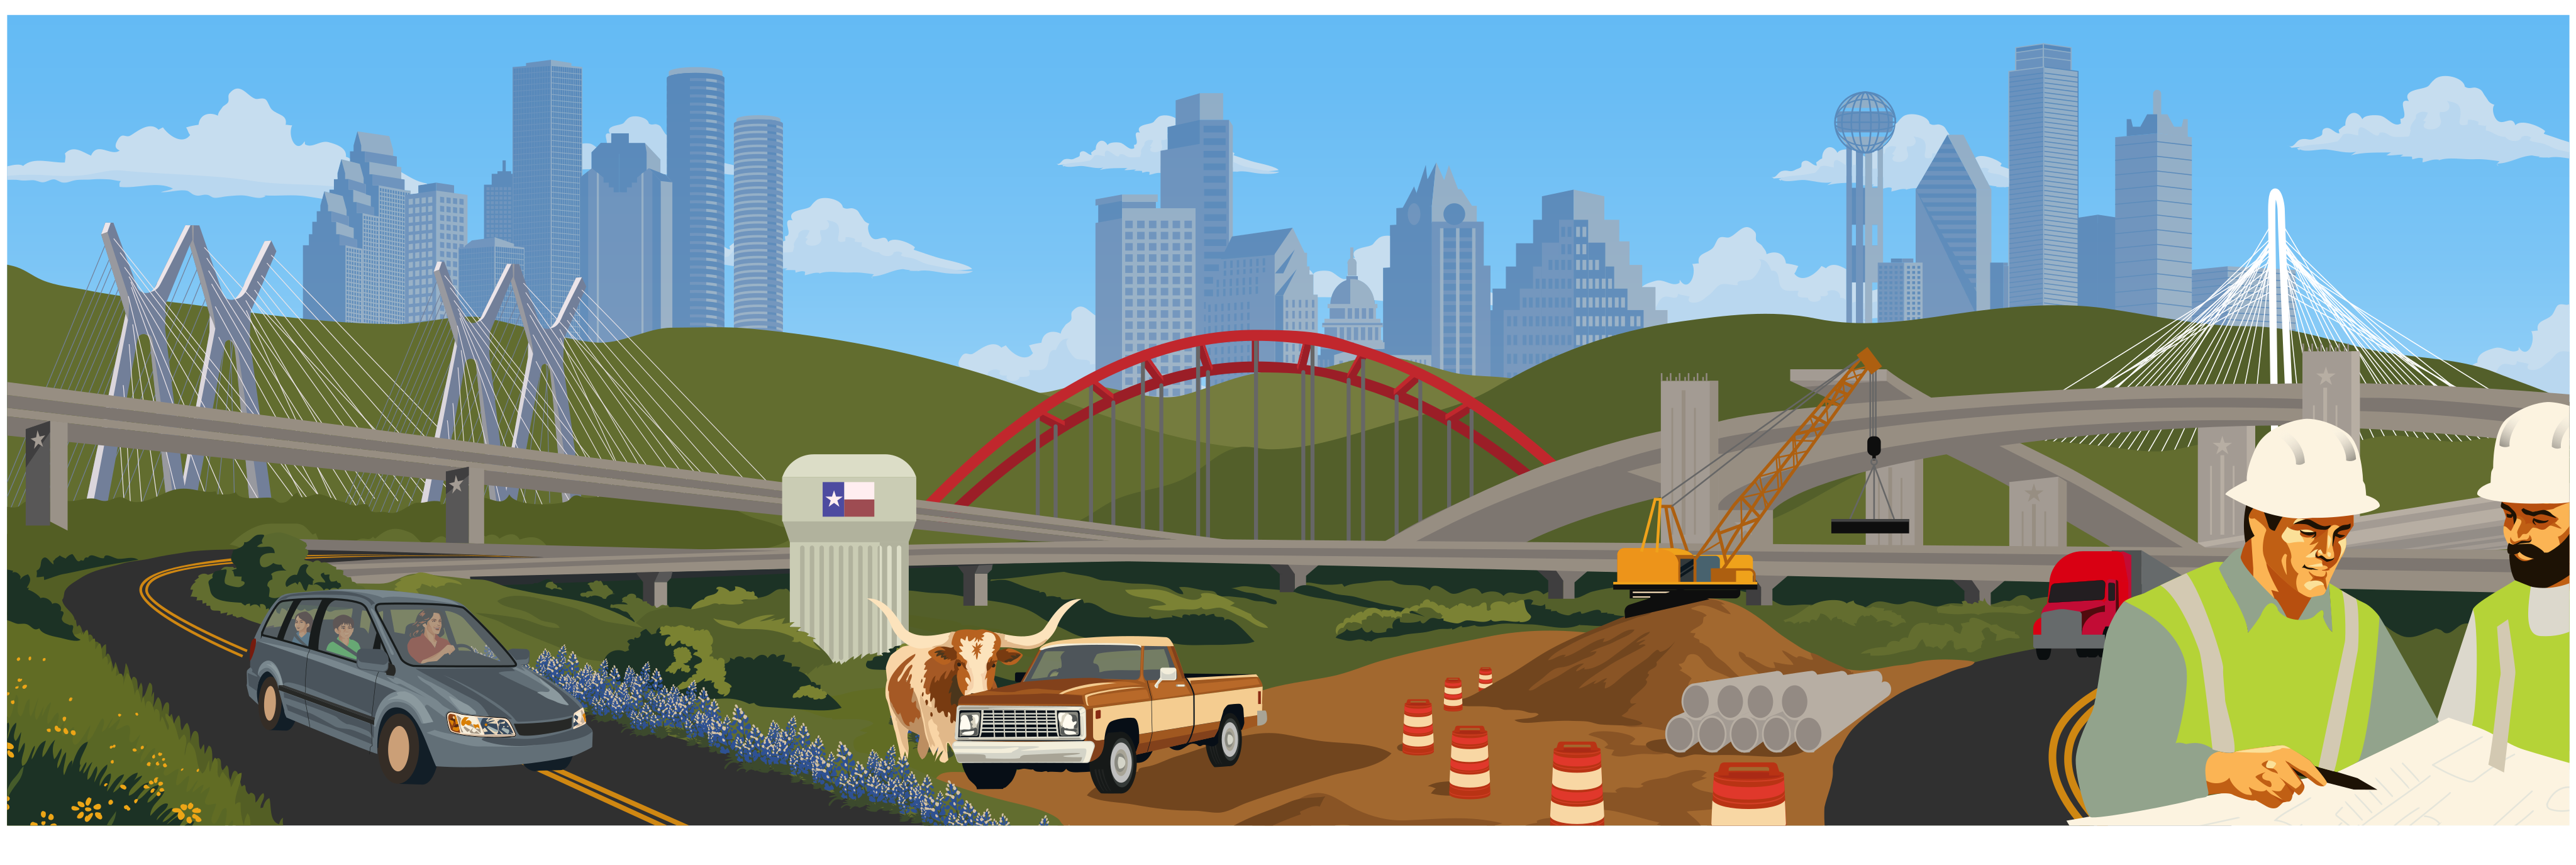
Illustration: orange pickup and traffic barrels on dirt hill
0%
Roads urgently need repair

Three in four Texans say some or most state roads need repair work today. The number holds in every region surveyed.

0%
Conditions will worsen

More than two-thirds expect roads to get worse if funding falls behind population growth.

0%
Maintenance is a public priority

Nearly every voter says ongoing repair and maintenance is important. It is the strongest agreement in the survey.

0%
Voters back additional funding

A clear majority say more funding for roads and highways is important, even when the trade-offs are stated outright.

Share the data.

Take the 2026 voter survey with you. Post it, print it, or send it to your lawmaker.

Slide 1 of 4: Headline Findings

Investment has made a difference

A little more than a decade ago, Texans approved Propositions 1 and 7 to put more resources into roads and highways.

Those decisions helped Texas expand capacity, improve safety, maintain bridges, and keep the state moving through years of rapid growth. Voters can see that progress. A majority of Texans say they are satisfied with the state's roads, highways, and bridges.

But progress does not mean the work is finished.

Construction costs are up 48% since 2022. Motor-fuel tax revenue faces long-term pressure as vehicles become more efficient and more Texans consider electric options. Population and freight demand keep growing. The next decade will depend on whether Texas keeps investing before the gap widens.

Two construction workers reviewing a blueprint with the Texas skyline behind them
$18.1B

Saved for Texas households each year through lower crash costs, less congestion, and reduced vehicle wear.

3,565

Lives saved on Texas roads from 2015 to 2023, including 977 lives in 2023.

$40B

Voter-approved investment through Propositions 1 and 7, funding that helped Texas keep pace during a decade of growth.

The $0HouseholdLedger

Texas households save an average of $2,301 each year because of roadway improvements that reduce crashes, congestion, and vehicle wear.

$0
In Congestion Relief

Time back for families, workers, and freight.

$0
In Traffic Safety

Fewer crashes, fewer injuries, and fewer costs tied to unsafe road conditions.

$0
In Vehicle Operating Costs

Less wear, fewer repairs, and smoother travel.

$0
In Bridge Maintenance

Fewer detours and better-maintained bridge infrastructure.

By Metro, Annually

Houston
  • 58 hrs / yrlost per driver stuck in traffic
  • $1,412annual household savings from a well-maintained network
  • 7.5M residentsthe nation's 4th-largest metro — and still growing
  • Port & freight gatewaymost U.S. Gulf trade and imported energy moves through here
Austin
  • 47 hrs / yrlost per driver stuck in traffic
  • $1,198annual household savings from a well-maintained network
  • 2.5M residentsone of the fastest-growing major metros in America
  • I-35 spineone interstate carries most Central Texas commuters and NAFTA freight
Dallas
  • 54 hrs / yrlost per driver stuck in traffic
  • $1,342annual household savings from a well-maintained network
  • 8.1M residentsTexas's largest metro and a national trade hub
  • I-35 & I-30 corridorcrossroads for Mexico-to-Midwest freight
Additional Metrics
32% drop in bridges rated poor since 2015. 1,800 new bridges built in the last decade. 5.4M Texas jobs dependent on the transportation network.

The weight of growth

What all that traffic and freight costs the pavement.

Roads and bridges wear on a predictable clock. Growth just speeds it up — and the scale of maintenance Texas needs is bigger than most people realize.

20 years

typical design life

A well-built Texas highway lane is designed for about two decades of service before it needs major rehabilitation. Every year past that, repair costs climb sharply.

That means thousands of lane-miles across Texas are aging out at the same time growth is adding new traffic.

Source · FHWA pavement design guidance

≈ 9,600 cars

per fully-loaded 18-wheeler

Pavement wear rises with the fourth power of axle weight. One heavy truck causes roughly the same damage as ~9,600 passenger cars — and Texas moves more freight than any other state.

More freight traffic means roads age faster than their design life assumes — and the repair tab grows with every extra truck.

Source · AASHTO Road Test · 4th-power rule

$1 : $6–$10

prevention vs. reconstruction

Every dollar spent on preventive maintenance saves six to ten dollars in future reconstruction. Falling behind on upkeep doesn't save money — it multiplies the bill.

Keeping up with preventive work is far cheaper than letting roads crumble and rebuilding them later.

Source · FHWA · asset-management research

Add the miles Texans drive to the freight moving across our roads — and it's easy to see why a maintenance program has to keep pace with growth, not chase it.

Longhorn steer standing in a field of bluebonnets

Texans Know

planning ahead costs less than catching up later.

When transportation investment keeps pace with growth, Texans see the benefits in everyday life: safer roads, more reliable commutes, less vehicle wear, better freight movement, and stronger connections between communities.

When investment falls behind, the costs show up slowly at first, then all at once. Traffic gets worse. Repairs get more expensive. Freight takes longer. Projects cost more to deliver. Families and businesses lose more time on the road.

0.00
Interstate fatality rate
per 100M vehicle miles
vs
0.00
All other Texas roads
per 100M vehicle miles
The takeaway

Interstates are more than twice as safe.

Source: TRIP, 2026 Texas Interstate report.

Plan Ahead

  • Roads are maintained before they fail.
  • Capacity is added before bottlenecks become permanent.
  • Freight keeps moving.
  • Families spend less time stuck in traffic.
  • Communities remain connected to jobs, schools, hospitals, and markets.
vs

Fall Behind

  • Maintenance needs become reconstruction costs.
  • Congestion spreads into more hours of the day.
  • Freight delays ripple through the economy.
  • Vehicle wear and fuel costs rise.
  • Fast-growing regions become harder and more expensive to serve.

Texas needs to keep planning ahead.

Roads and bridges are how Texas works every day. They connect families to schools, workers to jobs, freight to markets, patients to care, and communities to opportunity. Keeping that system strong takes a long view.

Plan beyond the next budget cycle.

Major transportation projects take years to design, permit, fund, and build. A state growing as fast as Texas cannot afford to plan only two years at a time.

Match investment to growth.

Population, freight, energy production, manufacturing, and port activity continue to rise. A road network built for yesterday's Texas cannot carry tomorrow's economy without continued investment.

Maintain before roads fail.

Preventive maintenance costs less than full reconstruction. Texans understand the tradeoff: 88% say maintaining roads and adding capacity is worth temporary closures and delays.

Keep rural Texas connected.

Infrastructure needs do not stop at major metros. Rural roads connect workers, producers, emergency services, school districts, and small businesses to the rest of the state.

Maintain the Miracle

Tell lawmakers to keep Texas infrastructure moving.

Add your name. We’ll route your message to the state representative and senator for your ZIP so they hear from Texans who want planning ahead, not falling behind.

  • Takes about 30 seconds
  • Delivered to your Texas House and Senate offices
  • Never shared with third parties
0/500

Sources & methodology

Where every figure comes from.

  1. 01

    TRIP, Saving Texans' Lives, Time and Money (2025)

    Open source ↗

    $18.1B household savings · $2,301 per household · 977 lives saved (2023) · 3,565 lives saved (2015–2023)

  2. 02

    Statewide Voter Survey, April 2026, Texas Infrastructure Now

    74% repair · 68% worsening · 88% maintenance · 60% additional funding · n=812 · ±3.4%

  3. 03

    Texas Department of Transportation, Unified Transportation Program (2024)

    Open source ↗

    $12.5B program · Props 1 + 7 · 1,800+ new bridges · 32% drop in poor-rated bridges since 2015

  4. 04

    Texas A&M Transportation Institute, Urban Mobility Report

    Open source ↗

    Per-driver congestion hours · Austin 47h · DFW 54h · Houston 58h · San Antonio 42h

  5. 05

    U.S. Census Bureau (2024) & FHWA Highway Statistics (2023)

    Open source ↗

    31.3M Texans · +50% since 2000 · 290B vehicle miles · 5.4M jobs tied to network

  6. 06

    Construction cost & methodology

    Construction costs +48% since 2022 (ENR-style index, Texas). Scenarios are decade-out projections from TxDOT, TTI, and FHWA modeling, not single-year forecasts.

  7. 07

    AASHTO Road Test — 4th-power rule

    Open source ↗

    One fully-loaded 18-wheeler causes pavement wear equivalent to ~9,600 passenger cars. Damage rises with the fourth power of axle weight.

  8. 08

    FHWA — pavement design life & preventive maintenance

    Open source ↗

    Typical highway lane design life ≈ 20 years. Preventive maintenance returns $6–$10 for every $1 spent versus reconstruction.